Job Market News
Top Data Visualization Courses Online

Introduction
Data visualisation is known as transforming the complex data into visual formats like chart crafts or maps. The main advantage of data visualisation is that it makes it easier to understand and interpret the information. This skill is extremely important nowadays because today’s world is data driven and it also has to uncover new patterns, trends and insights that cannot be easily seen from the word data without any visualisation.
If someone is a business professional that is aiming to make a decision related to data or a student that is enhancing their analytical skills or even someone that is only curious about the power of visual data then they can learn data visualisation to use these skills. However, there are many online courses that are teaching the skill of data visualisation on different levels and interest on online platforms. Some of the best ones are:
Data visualisation with Tableau specialization on Coursera by University of California
This is particularly designed for beginners and people that are focused on Tableau. Tableau is a leading data visualisation tool that makes work easier. In this course the main topic that is covered is related to the fundamentals of data visualisation with essential design principles. It also tells participants how to use visual analytics and how they can create dashboards and stories using Tableau. This course is followed by a capstone project which allows individuals to apply their skills to create a data visualisation.
The main advantage of this program is it is flexible and it allows individuals to learn according to their level and progress at their own pace.
Data visualisation with Python on Coursera by IBM
It is offered by IBM and this course is mainly about data visualisation by using Python’s libraries like seaborn and polium. The main advantage of this course is that it explores various types of visualisations from basic charts to specialised plots and even interactive dashboards.
This course mainly focuses on giving the hands-on experience to students which enables them to create their own visual representations of the real world data. But it is important to have a basic understanding of Python and its libraries before enrolling in this course.

Are you ready for the interview?
Practice interview questions in a real interview-style setting.
Data visualisation and communication with Tableau on Coursera by Duke University
This course not only gives participants the idea about reading visualisation, it also teaches them effective communication by the insights that are driven by the data. By using Tableau, participants can work on their projects that are focused on preparing data, designing interactive dashboards and also crafting and comparing data stories. This course is a part of the larger course which is Excel to MySQL.
It is also for those individuals that are interested in theoretical aspects of data visualisation because it covers the basic principles of visual perception, data representation and also interaction techniques. This program has to give the basic understanding of programming and also about web development to the learners.
Data visualisation with advanced Excel by PwC (Coursera)
This course is specially for people who are familiar with Excel and they are looking to increase their data visualisation skills. This course is extremely beneficial because it offers unique techniques to create valuable charts and dashboards. There are many topics that are included in these courses like using the right type of visualisation, designing principles and common mistakes to avoid. This course is particularly useful for individuals that are looking to enhance their data presentation skills.
In this course learners will most likely explore the topics that are related to conditional formatting and interactive elements in order to make their data presentation more advanced and dynamic. This course also provides real world examples and exercises which helps learners to be practical in their learning.
Data Visualization Nanodegree Program by Udacity
This program is offered by a respectful organisation which provides the acceleration of data visualisation on the topics from the basics to advanced storytelling techniques. In this course learners will learn about Python and Tableau in order to create interactive visualisation charts and dashboards. This program also includes real world examples and exercises projects for career support which makes it suitable for people who are looking to learn and have a comprehensive learning experience.
It also covers various aspects of data visualisations that are from renowned institutions like Harvard and Microsoft. However the topics also range from basic to fundamentals offering a unique blend of tools and techniques which allows learners to choose the strategy according to their interest and career goals.

Data visualisation courses by Datacamp
Free ATS Resume Maker & Analyzer
Create a resume that passes ATS checks and impresses recruiters in seconds.
Datacamp is famously known for offering short courses that focus on data visualisation by using different tools and languages like Python and Tableau. These courses are particularly for people to be interactive because they provide hands-on exercises that encourage learners to apply their concepts immediately to the real world experience. This course is available for all the skill levels so from beginners to advanced, everyone can take the course and enjoy the benefits.
Data visualisation techniques by Harvard Business School Online
It offers the various data visualisation techniques to learners and also emphasizes how to effectively use these techniques in order to make the decision making. There are many topics that are included in these courses like using the right type of visualisation, designing principles and common mistakes to avoid.
This course is particularly useful for individuals that are looking to enhance the data presentation skills. It is important to choose the right course according to your skill level and also decide what types of rules of the programming language you want to focus on while learning about data visualisation.
Conclusion
If someone is a business professional that is aiming to make a decision related to data or a student that is enhancing their analytical skills or even someone that is only curious about the power of visual data then they can learn data visualisation to use these skills. However there are many online courses that are teaching the skill of data visualisation on different levels and interest on online platforms. Data visualisation with Python on Coursera by IBM is offered by IBM and this course is mainly about data visualisation by using Python’s libraries like seaborn and polium.
The main advantage of this course is that it explores various types of visualisations from basic charts to specialised plots and even interactive dashboards. Data visualisation and communication with Tableau on Coursera by Duke University not only gives participants the idea about reading visualisation with it, it also teaches them effective communication from the inside that is driven by the data. In this course learners will learn about Python and Tableau in order to create interactive visualisation charts and dashboards.
This program also includes real world examples and exercises projects for career support which makes it suitable for people who are looking to learn and have a comprehensive learning experience. It also covers various aspects of data visualisations that are from renowned institutions like Harvard and Microsoft. By using Tableau participants can work on their projects that are focused on preparing data, designing interactive dashboards and also crafting and comparing data stories.
This course is a part of the larger course which is Excel to MySQL. These courses are some of the best to learn about data visualisation because they cover a wide range of topics and offer great advantages.
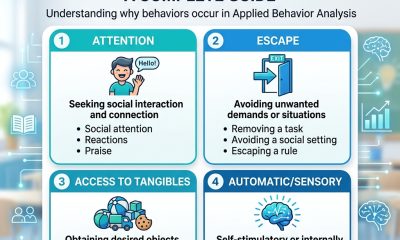

The 4 Functions of Behavior in ABA: A Complete Guide
Master the 4 functions of behavior (SEAT) with the complete ABA guide: definitions, clinical examples, function-based treatment table, functional assessment...
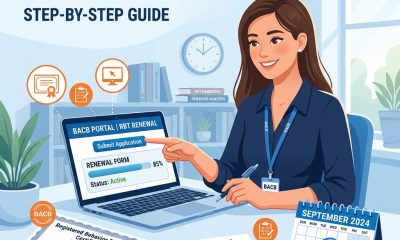

How to Renew Your RBT Certification: Step-by-Step Guide
Step-by-step RBT renewal guide: 4 required components, 90-day timeline, competency assessment requirements, what happens if your credential lapses, and year-round...


What to Do the Day Before and Day of Your Certification Exam
Day-by-day framework for the week before your exam, a specific night-before protocol, hour-by-hour exam morning guide, and in-exam tactics. Research-backed...


RBT Data Collection Methods: A Complete Guide
Complete guide to RBT data collection: continuous vs. discontinuous measurement, all 8 recording methods with tables, new 3rd Edition calculation...


ABA Therapy Techniques Every RBT Should Know
Complete guide to core ABA therapy techniques for RBTs: reinforcement types, DTT, NET, prompting hierarchies, chaining, differential reinforcement, and extinction....


RBT Supervision Requirements: Everything You Need to Know
Complete guide to RBT supervision requirements: the 5% monthly minimum, what qualifies as supervision, documentation standards, annual renewal, and what...
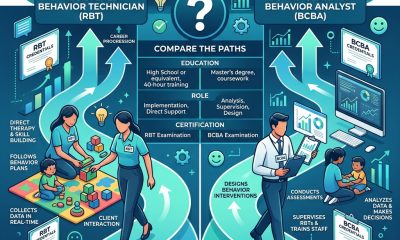

RBT vs. BCBA: What Is the Difference and Which Career Is Right for You?
RBT vs. BCBA: compare education requirements, salary data, scope of practice, and career timelines side by side. Includes 5 comparison...


RBT Practice Questions: How to Use Them Effectively
Research shows practice testing beats all other study methods by 43%. Learn how to use RBT practice questions with a...
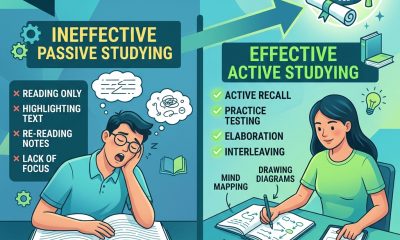

The Best Study Methods for Passing Difficult Exams
Science ranks retrieval practice 43% more effective than re-reading. Discover the 7 best study methods for certification exams, with research...


How Long Should You Study for a Certification Exam?
How long should you study for a certification exam? Use our 3-step calculation framework, reference table of 8 certifications, Ebbinghaus...


Most Common Mistakes Students Make on Certification Exams (And How to Avoid Them)
Research shows 57% of answer changes go from correct to wrong. Discover the 10 most damaging certification exam mistakes —...

How to Pass the RBT Exam on Your First Attempt (Complete 2026 Guide)
The RBT exam has a ~68% first-attempt pass rate. Learn the exact 8-week study plan, domain breakdown with weighted tables,...

Top 10 Interview Questions For A Team Leaders
In order to increase your chances of landing a position as a team leader, it is essential to demonstrate your...

Interview Question For A Learning Support Assistant
Fear about possible questions for interviews are normal if you’re seeking a job as a learning support teacher. Remember that...

Top 10 Common Questions Asked In Sainsbury’s Interview
Everything you need to know about Sainsbury’s interview questions is right here. 10 most important question that might asked throughout...

10 Common Questions For Sen Teaching Assistant
When applying for a special needs teaching assistant position, demonstrate the hiring manager that you have the skills and compassion...

15 Questions Samples To Ask At End Of Teaching Assistant Interview
Here are some questions samples, you should ask the interviewer at the end of the teaching assistant interview. 15 Questions...

Interview Questions And Answers For Sales Associates
Your sales associate interview is a chance to sell yourself to the recruiting manager by discussing and demonstrating your interests,...

How To Write A Cover Letter In An Attractive Way?
Attaching a cover letter to your CV is a one-page document that serves the purpose of introducing you to a...

Interview Tips For A Supervisor Job
The interview questions you face for a management or supervisory role could differ from those you face for other positions....

What Are Competency Based Questions? The Ultimate Guide
A competency-based interview will focus on testing your knowledge, abilities, and character traits as they pertain to the position for...

Top 25 Tesco Interview Questions And Answers: Ultimate Preparation Guide
Preparing for a job interview can be a nerve-wracking experience, especially when it comes to a reputable company like Tesco....

10 Best Questions Samples For A Phone Interview
To ensure the applicants they promote to the hiring manager fit their criteria, recruiters typically employ phone interviews as a...

Top Interview Questions & Answers For Care Assistant
You may be wondering how to improve your chances of being hired if you are a personal care professional who...

Sample Interview Questions & Answers For Customer Service
If you’re interested in applying for a career in customer service, it’s important to prepare for your interview. This may...

Top 10 Interview Question For Boots
Boots is a successful pharmacy-led health and beauty business well-known for its dedication to providing excellent customer service and high-quality goods....

10 Common Safeguarding Interview Questions For Teaching Assistant.
You will be questioned on a range of issues when you attend an interview for the teaching assistant position. You...

Top 13 Excel Interview Questions & Answers
The most used spreadsheet program is Microsoft Excel. Every expert working in a big or medium-sized business nowadays uses this...

How To Answer The Question: What Do You Know About Aldi?
When you are getting ready for an interview at Aldi, it is essential to be prepared for certain questions that...

10 Best Answers For “Why Should We Hire You?
No matter the industry or position you’re seeking, some types of questions are sure to come up during a job...

16 Most Important Interview Questions For Teacher
Preparing for a job interview in the field of education? You may feel a mixture of excitement and anxiety. The...

Top 11 Retail Assistant Interview Questions
An interview provides you with the chance to showcase your abilities, personality, and work ethic to a potential employer while...

Top 10 Administration Assistant Interview Questions
Administrative professionals are in high demand. Using these abilities has actually been one of the five most sought-after job categories...

Top 10 Morrison’s Interview Questions And Answers
The supermarket chain Morrisons is one of the most successful in the UK and is well-known for its dedication to...

What Makes A Good Sen Teaching Assistant?
Students who have difficulty learning are provided with extra learning opportunities by a special educational needs (SEN) teaching assistant, who...

Best Answers To “Where Do You See Yourself As A Teacher In 5 Years?”
When you decide to pursue a career in education, you are not just making a professional decision; you are committing...

Top 10 Safeguarding Interview Questions For Support Workers
Those who serve as support workers are vital in ensuring that at-risk youth, families, and the elderly can live fulfilling,...

10 Common Interview Questions For McDonald’s
If you work for the most profitable business in history, flipping burgers is definitely not a dirty job. Fast food...

10 Important Interview Questions For Eyfs Teaching Assistant
Proven strategies and insightful responses to 11 key questions for seamless integration into the world of play-based learning and individualized....

10 Common Questions And Answers For Childcare Interview
Working with kids is satisfying and hard. Before you can teach your kids, you must pass the recruiting procedure, which...

Tips To Answering Behavioral Interview Questions
Interviewers can ask about your prior actions and reactions to certain scenarios to get a feel for how you might...

Best Personal Statement Samples For Civil Service Job
An accompanying personal statement may be necessary when applying for a position in the public sector. You may learn more...

Top 10 Common Safeguarding Interview Questions Of Staff
Many industries prioritize safeguarding, notably those that care for staff, the elderly, and the disabled. This field requires professionals who...

Top 10 Interview Tips For Teacher
When you are applying for jobs at a variety of educational institutions, the interview that you have with the potential...

Top 15 Reasons To Leave A Job
Leaving one’s work was not only unusual but also considered to be something of a social faux pas. Why, after...


How Does an Assistant for Lawyers Get Hired by a Law Firm?
The many career opportunities offered by law make this profession one of the most sought-after and popular in the worldwide...


How to Conduct a SWOT Analysis for Career Growth
Introduction A SWOT analysis is a simple cut powerful tool that helps to understand these strengths, weaknesses, opportunities and threats...


How to Stay Motivated During Long Job Searches
Introduction The most challenging and frustrating process is looking for a job especially when it takes longer than expected to...


How to Handle Situational Questions Effectively
Introduction Situational questions refer to tests that are taken to test the ability of a candidate to think critically, solve...


Tips for Researching Hiring Managers on LinkedIn
Introduction In today’s competitive and advanced top market it is important to know about how to reset hiring managers on...


The Role of Job Shadowing in Interview Prep
Introduction Job interviews can be extremely stressful especially when someone is entering a new field or applying for a job...


How to Create a Job Application Tracker
Introduction It can be stressful to look for a job especially when someone wants to apply in multiple positions. By...


Top Courses for Enhancing Remote Work Skills
Introduction Remote works are now considered as a major part of today’s professional world. They provide people with flexible schedules,...


How to Master Professional Email Writing Through Online Classes
Introduction In today’s digital and fast paced world, professional email writing is considered as an important skill. If someone is...


Certifications in Workplace Diversity and Inclusion
Introduction In today’s fast paced and digital world there are work places that are becoming more diverse than they ever...


Top Programs for Building Financial Literacy Skills
Introduction Financial literacy is an important life skill that helps the individuals to manage their money and to make informed...


Certifications for Advanced Team Collaboration Skills
Introduction It is important to have teamwork in today’s workplace because it has to build the companies. There are companies...


Tips for Reviewing Company Financials Before Interviews
Introduction When we candidates are preparing for the job interview they only focus on their resume, possible interview questions and...

How to Build a STAR Story Bank for Interviews
Introduction Job interviews can be quite stressful to manage especially when the employers ask behaviour in questions like tell me...


How to Use Nonverbal Cues Effectively During Interviews
Introduction Interviews are considered as an opportunity to present yourself in front of the employers. They are not only about...

Ultimate Guidance: How To Give A Great Job Interview Presentation?
During an interview, you can be requested to deliver a presentation on a subject that is pertinent to the position....

How To Write A Job Application Letter Efficiently?
At the same time that the world is becoming a better place, competition for jobs is heating up. Finding a...

Top 10 Ways To Make A Great LinkedIn Profile
You should have an interesting LinkedIn profile at every point in your job hunt. LinkedIn is easily the biggest professional...

Top 10 Questions And Answers For A SQL Interview
The following is a list of the most prominent and helpful SQL interview questions and answers for applicants who are...

Top Teaching Assistance Online Courses
Could you see yourself working as an assistant in a classroom? The importance of teaching assistants has increased significantly in...

Is Being A Teaching Assistant Worth It?
Teaching assistants (TAs) play a vital role in the ever-changing field of education. They assist teachers significantly and substantially contribute to...

Top 5 Online Courses For Excel
FOAt the most basic level, Microsoft Excel is a spreadsheet tool used to gather, analyse, and display qualitative and quantitative...

Top Reasons Why Safeguarding Is Important
If your company does business with or is otherwise frequently connected to children and/or people who are vulnerable, one of...

How To Become A Teaching Assistant?
Do you want to become a teaching assistant but don’t know where to begin? A teaching assistant in the classroom...

Most Common Questions To Ask At End Of Teaching Assistant Interview
The secret to acing an interview is preparation, which includes studying up on the organization and the most typical questions...

Top Training Courses For A Sen Teaching Assistant
The key problem with effectively supporting students with Special Educational Needs (SEN) in educational settings is one that the SEN...

How to Answer “Why Do You Want To Be A Teacher?”
Employers may use this question to determine whether or not you are a committed teaching professional by making use of...

What Makes A Good Teaching Assistant?
A classroom doesn’t work without a teaching assistant. By ensuring that every student has access to the resources they need...

Top 15 Interview Questions For Nursery Assistant
You may be well-prepared for the interview by reading the questions ahead of time, but your greatest chance of landing...


Is It Possible To Become A Teacher Assistant Without Any Experience?
When working in an educational environment, teaching assistants and aids collaborate with the primary instructors. In addition to providing assistance...

Which Skills Are Needed To Work In The Nursery?
Beginning a career at a nursery may be quite satisfying since it provides the opportunity to directly influence the early...

Top 15 Qualities Of A Good Teacher
The most effective teachers, whether they work in traditional Classroom settings or online, have a set of traits that make...


Why It’s Important to Modernize Your Skills and Keep Up With New Health Tech?
Healthcare is evolving at an unprecedented pace, driven by technological advancements and innovative treatment methods. For professionals in the medical...


Clean Audit: Building a Culture of Year-Round Compliance
For many organizations, the annual audit feels like a high-stakes event that demands intense preparation in a short window of...


Marketing Playbook: Evergreen Tactics That Actually Drive ROI
Marketing trends come and go, but some strategies consistently deliver results regardless of industry shifts. These evergreen tactics form the...
-

 Interview Preps2 years ago
20 Caregiver Interview Questions And Answers
-
 Interview Preps1 year ago
Why Should We Hire You As A Teacher? Practical Answers
-

 Interview Preps1 year ago
Top 35 Must Know Greggs Interview Questions & Expert Answers!
-
 Interview Preps1 year ago
The Most Common Questions For Aldi Video Interview
-
Interview Preps1 month ago
What Are Competency Based Questions? The Ultimate Guide